
Ever jumped into a hot crypto token 🚀 only to watch your position bleed red despite the price going up? You’re not alone! Those hidden trading costs are profit killers that most traders completely ignore.
Here’s the truth: You need a reliable crypto trading fees calculator to survive in this game. This guide gives you the exact formulas and break-even math to know if a trade makes sense before you hit that buy button.
Table of Contents
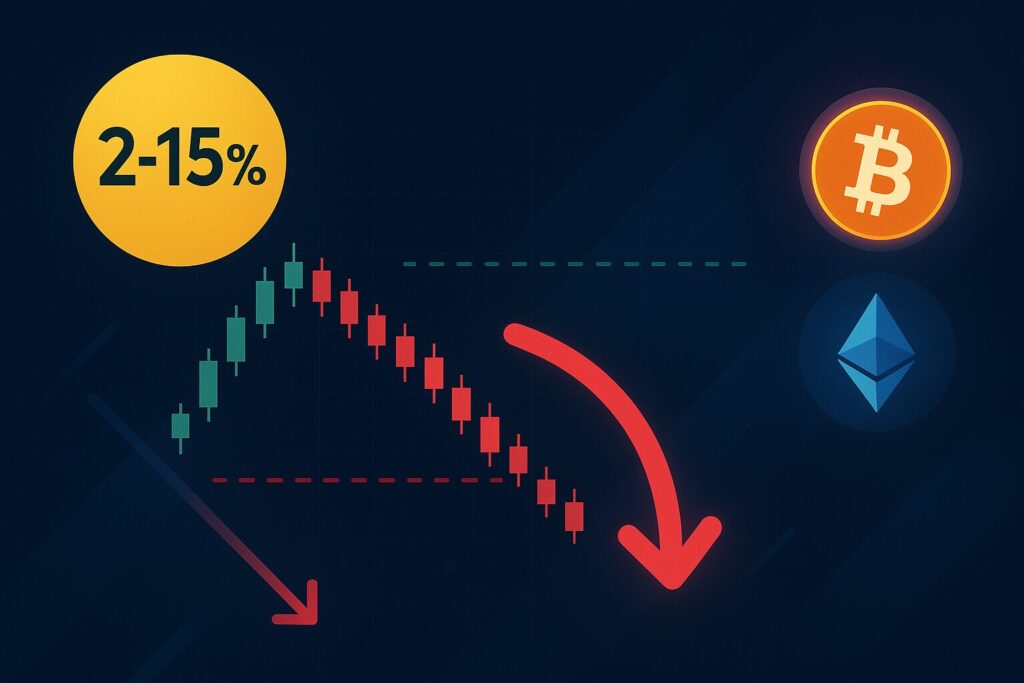
What is slippage in crypto trading and how much does it cost?
Slippage is the difference between the price you expect to pay and the price you actually get filled at, and it can easily cost you 2-15% per trade. In volatile crypto markets, this “invisible tax” often turns winning trades into instant losses.
When you’re buying a token that’s pumping 🚀, you might see it at $1.00 on your screen, but by the time your order executes, you’re actually paying $1.08 or even $1.15. That’s 8-15% slippage right off the bat, meaning the token needs to pump an additional amount just for you to break even. The problem compounds during high volatility periods like token launches, major news events, or when everyone is trying to buy/sell at once.
Types of Slippage:
- ✅ Positive Slippage: Get better price (rare in fast markets)
- ❌ Negative Slippage: Pay more than expected (usual scenario)
- 🤖 MEV Bot Slippage: Bots sandwich your trade for maximum pain
Real Example: During the PEPE launch, traders experienced 8-12% slippage on both entry and exit, making it nearly impossible to profit even on a token that pumped 50% in minutes.
Free Crypto Trading Fees Calculator
How much do crypto trading fees actually add up to?
Trading fees seem small individually but compound into massive profit killers, often totaling 5-20% of your position before you even consider price movements. Most traders focus on advertised rates while ignoring gas, slippage, and hidden charges that multiply real costs.
Platform Fee Breakdown:
- CEX Trading: 0.02-0.25% per trade (both sides)
- DEX Swaps: 0.1-0.3% + gas fees ($5-200+)
- Telegram Bots: 0.5-1% + gas + slippage premium
- Gas Fees: Wildly variable, can be 1-10% of small positions
The real shock comes when you add everything up. A typical bot trade might cost: 1% bot fee + 4% entry slippage + 4% exit slippage + $50 gas (5% on $1,000 position) = 14% total costs. Your token needs to pump 14% just to break even! 😱
What is the exact break-even formula for crypto trades?
The break-even formula is surprisingly simple: your entry price multiplied by (1 + total cost percentage). However, most traders never calculate total costs properly, leading to systematic losses even when they pick direction correctly.
The Master Formula:
Break-Even Price = Entry Price × (1 + Total Costs%)

Total Costs% = Entry Slippage% + Exit Slippage% +
               Trading Fees% + (Gas Fees$ ÷ Position Size$)
Real Calculation Example:
- Entry Price: $0.50 per token
- Position Size: $2,000
- Entry Slippage: 3%
- Exit Slippage: 3%
- Bot Fee: 1%
- Gas: $60 (3% of position)
- Total Costs: 3% + 3% + 1% + 3% = 10%
- Break-Even Price: $0.50 × 1.10 = $0.55
This means your $0.50 token must reach $0.55 (10% gain) just to break even! 📊
Why do scalpers lose money despite high win rates?
Scalpers lose money because trading costs eat up their small profit targets, requiring unrealistic win rates of 60-70% just to break even. The math is brutal: frequent small wins get destroyed by occasional large losses plus guaranteed costs on every trade.
Consider a scalper targeting 15% gains with 8% total costs per trade. Their net profit per winning trade is only 7%, but when they lose 10%, their real loss becomes 18% including exit costs. This creates a terrible risk/reward ratio where they need to win roughly 65% of trades just to break even over time.
Scalping Reality Check:
- Target gain: 15%
- Total costs: 8%
- Net profit: 7%
- Loss + costs: 18%
- Required win rate: 65%+ just to break even! 😤
Real scalpers often achieve 70% win rates but still lose money because the few big losses (18-25% including costs) wipe out many small wins (7% net). This is why telegram groups full of “successful scalpers” mysteriously blow up their accounts every few months.

Are Telegram trading bots worth their 1% fees?
Telegram bots can be profitable for targeting large moves (30%+ gains) where speed matters. The key is understanding when speed justifies making the slippage higher versus when you’re paying extra to lose money faster.
When Bots Make Sense 🎯:
- Targeting 50%+ gains (costs become manageable)
- Token launches requiring instant execution
- Breaking news trades where seconds matter
- Arbitrage opportunities exceeding all costs
Best Telegram Bots Available:
- 🇺🇸 English: https://telegramtrading.net/best-telegram-sniper-bots/
- 🇸🇦 Arabic: https://telegramtrading.net/best-sniper-bots-arabic/
- 🇷🇺 Russian: https://telegramtrading.net/best-sniper-bot-telegram-ru/
- 🇪🇸 Spanish: https://telegramtrading.net/mejores-sniper-bots-cripto/
- 🇫🇷 French: https://telegramtrading.net/meilleurs-sniper-bots-telegram/
- 🇧🇷 Portuguese: https://telegramtrading.net/melhores-bots-sniper-telegram/
- 🇹🇷 Turkish: https://telegramtrading.net/en-iyi-telegram-kripto-sniper-botlari/
Success Story: During Coinbase’s $BONK listing announcement, a trader used a bot to buy $1,000 within seconds, paying 6% total costs but capturing a 340% pump for 334% net profit. The speed was worth every penny! ✅
How do DEX costs compare to centralized exchange fees?
DEX trading appears cheaper but hidden costs like gas fees and slippage can make it 3-10x more expensive than centralized exchanges, especially for smaller positions. The unpredictability of these costs makes position sizing and timing crucial for profitability.
Cost Comparison Table:
| Platform Type | Base Fees | Hidden Costs | Total Range |
|---|---|---|---|
| 🏛️ CEX | 0.02-0.25% | Minimal slippage | 0.1-0.6% |
| 🦄 DEX | 0.1-0.3% | Gas + slippage | 2-15% |
| 🤖 Bots | 0.5-1% | Gas + premium slippage | 2-20% |
The real difference becomes obvious during network congestion. A $500 DEX trade during busy periods might cost $75 gas + $50 slippage = $125 total (25% of position), while the same trade on a CEX costs $2.50 in fees. For positions under $2,000, CEXs almost always win on pure economics.
What hidden costs destroy crypto trading profits?
Gas fees and slippage timing are the biggest hidden profit destroyers, often adding 5-15% to your costs when you least expect it. These costs spike during the exact moments when trading opportunities are most attractive, creating a vicious cycle.
The Hidden Cost Multipliers 💸:
- Network congestion during breaking news
- Low liquidity on new or small tokens
- Sandwich attacks by MEV bots
- Batch transaction failures requiring multiple attempts
Gas fees exemplify this perfectly. You see Ethereum gas at $15 and plan your trade, but when major news breaks and everyone rushes to trade, gas spikes to $120+ per transaction without warning. Your planned $1,000 trade with 3% costs suddenly becomes a 15% cost nightmare, turning a good setup into a guaranteed loss.
The psychological trap is that these moments feel like the best opportunities. New token launches, breaking news, major pumps – these are exactly when costs explode but traders feel most compelled to act quickly.
How to calculate if a crypto trade is actually profitable?
Calculate total costs first, then determine the minimum gain needed for your target profit, and finally assess the realistic probability of achieving that gain. Most trades fail this basic math test, which is why successful traders make fewer, higher-conviction plays.
Pre-Trade Checklist ✅:
- Total Costs: Add all fees, slippage, and gas as % of position
- Break-Even: Calculate minimum gain needed
- Target: Add desired profit to break-even
- Probability: Honestly assess likelihood of reaching target
- Risk/Reward: Compare potential loss + costs vs potential gain – costs
Real Example: Considering $1,500 position in trending altcoin via DEX during moderate activity. Costs: 2% entry + 2% exit + 0.3% fees + $45 gas (3%) = 7.3% total. For 25% profit target, need 32.3% token pump. Ask yourself: “What’s the probability this token pumps 32%+ in my timeframe?” If under 60%, skip the trade! 🚫
What position sizes work best with high trading costs?
Larger positions dilute fixed costs like gas fees, making high-cost strategies more viable, but you must factor total costs into your risk calculation rather than just price movement risk. The sweet spot balances cost efficiency with proper risk management.
Position Sizing Guidelines:
- Minimum viable: Gas fees <2% of position
- Cost efficient: Total costs <5% of position
- Risk adjusted: Never exceed comfort zone including all costs
If you’re comfortable risking $500 and total costs are 8%, your maximum position should be $460, not $500. This ensures even total loss scenarios don’t exceed your risk tolerance when costs are included. Many traders blow accounts by ignoring this simple rule, treating costs as “extra” rather than part of their risk! 💀
Can you make money day trading with high slippage and fees?
Making money day trading with high costs requires exceptional edge and discipline that 95% of traders don’t possess, plus win rates of 65%+ just to break even. The math is possible but the psychology and execution are brutal for most people.
Day Trading Reality with 8% costs per round trip:
- Need 60%+ win rate just to break even
- Average wins must exceed average losses by significant margin
- Perfect discipline required – no revenge trading or FOMO
- Constant market analysis and edge identification
- Substantial starting capital to make profits meaningful
Most successful “day traders” actually make their money from a few big swing trades per year rather than consistent daily profits. The ones posting screenshots of daily gains usually blow up within 3-6 months when costs accumulate and inevitable losing streaks hit. Focus on swing trading or position trading where costs become negligible relative to potential gains! 🎯
How do trading costs affect different crypto strategies?
Trading costs heavily favor lower-frequency, higher-conviction strategies where large potential gains dwarf the fixed costs of entering and exiting positions. High-frequency strategies get murdered by costs unless you have institutional-level fee structures.
Strategy Cost Impact:
| Strategy | Frequency | Target Gains | Cost Impact |
|---|---|---|---|
| 📈 Scalping | Multiple daily | 5-20% | Devastating |
| 📊 Day Trading | Daily | 15-50% | High |
| 🎯 Swing Trading | Weekly/Monthly | 50-200% | Manageable |
| 💎 Position Trading | Monthly+ | 100%+ | Minimal |
The math is unforgiving: scalpers with 10% round-trip costs targeting 15% gains net only 5% per win, requiring 70%+ win rates. Swing traders with the same 10% costs targeting 100% gains net 90%, requiring only 40% win rates for profitability.
This is why crypto legends like those who caught SOL at $8 or AVAX at $2 are position traders, not scalpers. They let their winners run massive distances, making costs irrelevant! 🚀

About the author
Learn more about us or contact us
![[LIVE] Top Polymarket Smart Wallets for Copy Trading](https://telegramtrading.net/wp-content/uploads/2026/03/Smart-Wallets-for-CopyTrading-on-Polymarket.jpg)
![[Full Guide] How to Copy Trade on Kalshi Using Kreo Bot](https://telegramtrading.net/wp-content/uploads/2026/03/kalshi-leaderboard-monthly-profit.png)
![[TUTORIAL] How to Copy Trade Smart Wallets on Polymarket Using PolyGun](https://telegramtrading.net/wp-content/uploads/2026/03/polymarket-leaderboard-monthly-profit.png)