Every crypto trader has felt it: you pick the right token, the price moves your way, and you still lose money. The culprit is almost never bad analysis. It is trading costs you never added up. This guide breaks down the exact math behind crypto slippage calculators, break-even formulas, and the hidden fees that silently drain every position you take.
Key Takeaways
- Total trading costs on DEX and bot trades routinely hit 8 to 15 percent per round trip.
- Break-even price equals your entry price multiplied by 1 plus total cost percentage.
- Gas fees and slippage spike hardest during the moments you most want to trade.
- Swing and position trading are the only strategies where costs become manageable.
What Is Slippage in Crypto Trading?
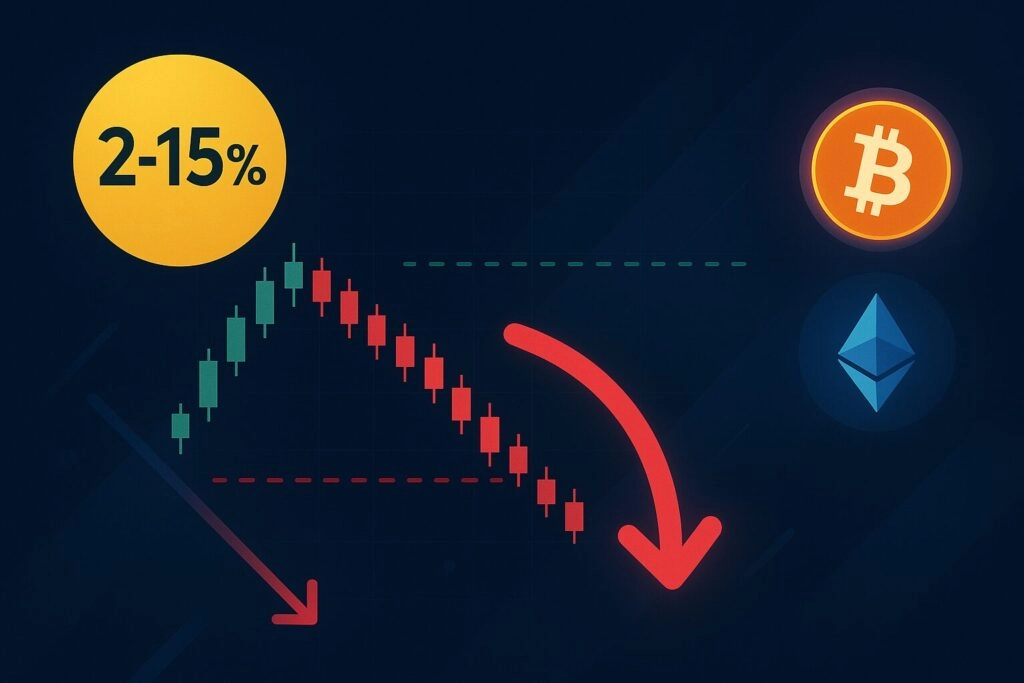
Crypto slippage is the gap between the price you see on screen and the price your order actually fills at. On a fast-moving token, that gap can be 2 to 15 percent in a single direction. Buy side and sell side both carry it, so a round trip can cost you 4 to 30 percent before fees or gas touch the position.
The 3 types that hit traders hardest are negative slippage (you pay more than the quote), MEV sandwich slippage (a bot front-runs your transaction and takes the spread), and low-liquidity slippage (thin order books on new tokens where even small buys move the price). During the PEPE launch, traders reported 8 to 12 percent slippage on both entry and exit, which meant a token that pumped 50 percent still left most buyers flat or negative.
Free Crypto Slippage and Trading Fees Calculator
Enter your trade details below. The calculator shows your total cost percentage and the exact break-even price your token must reach before you are in profit. All inputs update the result in real time.
Crypto Trading Fees & Slippage Calculator
Real-time break-even analysis
How Much Do Crypto Trading Fees Actually Add Up To?
The advertised fee is the smallest part of your cost. On a typical Telegram bot trade, you pay the 1% bot fee, then 3 to 5 percent entry slippage, another 3 to 5 percent exit slippage, and gas that can reach $50 to $150 on Ethereum during busy windows. On a $1,000 position, that stacks to 12 to 16 percent total before the token moves a single cent in your favor.
Centralized exchanges look expensive at 0.1 to 0.25 percent until you compare it to the full DEX cost picture. A $500 trade on a CEX costs $2.50. The same trade routed through a DEX during network congestion can cost $125 in gas and slippage alone, which is 25 percent of the entire position. For any trade under $2,000, CEX economics are almost always better on paper unless speed or token availability forces the DEX.
- 🏛️ CEX base fees: 0.02 to 0.25 percent per side, minimal slippage on liquid pairs.
- 🦄 DEX swap costs: 0.1 to 0.3 percent pool fee plus gas plus 2 to 10 percent slippage.
- 🤖 Telegram bot total costs: 0.5 to 1 percent fee plus gas plus premium slippage, often 5 to 20 percent combined.
- ⛽ Gas fees: $5 to $200 on Ethereum, near zero on Solana, but spike without warning during congestion.
The Exact Break-Even Formula for Crypto Trades
The formula has 2 parts. First, calculate total cost percentage by adding entry slippage, exit slippage, trading fees, and gas as a percentage of position size. Second, multiply your entry price by 1 plus that decimal. That is the minimum exit price where you break even after all friction.
Using real numbers: a $2,000 position at $0.50 per token with 3 percent entry slippage, 3 percent exit slippage, 1 percent bot fee, and $60 gas (3 percent of position) gives a 10 percent total cost and a break-even price of $0.55. The token needs a 10 percent move just to get you back to zero. Run this before every trade, not after.
Why Scalpers Lose Money Despite High Win Rates
Scalping targets 5 to 20 percent gains while carrying 8 to 10 percent round-trip costs. That leaves a net profit of 5 to 7 percent per win. But a single losing trade where exit slippage compounds the loss creates an 18 to 25 percent actual loss including costs. To break even over time, a scalper needs to win roughly 65 percent of trades consistently, a bar almost no retail trader clears for more than a few weeks.
The deeper problem is timing. The best-looking scalp setups appear during volatile launches and breaking news, which is exactly when slippage and gas are highest. A trader targeting a 15 percent pump during a major token announcement might face 12 percent combined costs, leaving 3 percent net on a win while a loss costs 27 percent. That risk/reward ratio is structurally broken regardless of how good the analysis is.
- 📊 Net profit per winning scalp: 5 to 7 percent after 8 percent costs on a 15 percent target.
- 💀 Actual loss per losing scalp: 18 to 25 percent including exit costs.
- 📈 Win rate needed just to break even: 65 percent or higher, consistently.
- ⏰ When it gets worse: during the exact high-volatility moments scalpers target most.
Are Telegram Trading Bots Worth Their 1% Fee?

The 1 percent bot fee is never the main cost on a bot trade. Slippage and gas dwarf it on every transaction. What bots actually sell is speed, and speed is only worth paying for when the opportunity has a large enough upside to absorb the full cost stack. Paying 6 percent total costs to capture a 340 percent pump is an excellent trade. Paying 6 percent to try to catch a 12 percent move is a structural loser.
Bots make sense for token launches requiring block-0 entry, migration sniping when a token completes its bonding curve, and breaking news trades where seconds determine whether you get the pump or the dump. They make no sense for patient swing entries where you can set a limit order and avoid slippage entirely. Match the tool to the trade type.
- ✅ Use a bot: launches, migrations, news-driven pumps targeting 50 percent or more.
- ❌ Skip the bot: patient swing entries, DCA accumulation, positions where slippage tolerance is low.
- ⚡ MEV protection: top bots route via Jito on Solana or private RPCs on EVM to cut sandwich slippage by 30 to 60 percent.
- 💰 Cashback offsets fees: bots like Maestro and Trojan return 10 to 45 percent of fees, reducing effective cost below 1 percent for active traders.
DEX Costs vs Centralized Exchange Fees
DEX trading looks cheaper until you include gas and slippage. The pool fee of 0.1 to 0.3 percent is real, but it sits on top of gas that can hit $150 on Ethereum and slippage that scales with position size and token liquidity. A $500 DEX trade during network congestion can cost 20 to 30 percent of the position in combined friction. The same trade on Binance or Coinbase costs under $2.
The calculus flips for 3 specific cases: tokens that only exist on a DEX, trades where self-custody is non-negotiable, and opportunities where CEX latency would cause you to miss the move entirely. Outside those 3 cases, for any token available on both, the CEX is cheaper for positions under $5,000. For larger positions, DEX slippage as a percentage shrinks while the fixed CEX fee stays flat, so the crossover point moves depending on size and gas conditions.
How Trading Costs Affect Different Crypto Strategies
Trading frequency is the single biggest variable in how much costs damage your returns. A scalper doing 5 round trips per day at 8 percent each needs 40 percent total gains daily just to break even. A swing trader doing 2 trades per month at the same cost structure needs 16 percent per month in gains, a very different bar. Position traders holding for weeks or months dilute costs to near zero as a percentage of eventual gains.
The traders who build lasting accounts treat high-cost strategies as tools for specific high-conviction moments, not daily routines. They use fast bots for launches and migrations, limit orders for patient swing entries to eliminate entry slippage entirely, and hold through volatility rather than churning in and out. The strategy cost table below makes the math visible at a glance.
Round-trip costs routinely exceed the gain. Net result is often negative.
Thin margin after costs. Profitability is marginal unless execution is tight.
Costs become a small fraction of the gain. Net result is strong.
Lowest relative cost of any strategy. Net result is excellent when the thesis plays out.
The position sizing rule that most traders skip: gas fees should never exceed 2 percent of your position. If you are putting $200 into a trade and gas is $10, that is 5 percent before slippage or bot fees. Either increase position size to make the trade cost-efficient or skip it entirely. Many accounts blow up not from bad picks but from trading sizes that make costs mathematically unsurvivable.
Frequently Asked Questions
A crypto slippage calculator takes your entry price, position size, expected entry and exit slippage, trading fees, and gas costs, then outputs your total cost percentage and the exact break-even price your token must reach for the trade to turn profitable. The one on this page updates in real time as you adjust any input field.
Add every layer: entry slippage percentage, exit slippage percentage, platform or bot fee, and gas converted to a percentage of your position size. The formula is total costs percent equals entry slippage plus exit slippage plus fees plus gas divided by position size times 100. Most traders forget gas and exit slippage, which are often the 2 largest components.
Break-even price equals entry price multiplied by 1 plus total cost percentage expressed as a decimal. If you buy at $1.00 with 10 percent total costs, your break-even is $1.10. The token must reach that price before you profit by a single cent after all friction is paid.
Yes, for time-sensitive trades targeting large moves. Bot fees are typically 1 percent, but the speed advantage on launches and migrations can mean the difference between a 200 percent gain and missing the move entirely. For patient swing entries, skip the bot and use limit orders to eliminate entry slippage, which is usually a bigger cost than the bot fee itself.
It is possible but requires a win rate above 65 percent consistently, which fewer than 5 percent of retail traders sustain. High round-trip costs mean small wins barely cover the math while losing trades carry outsized damage. Swing and position trading are structurally more viable for accounts under $50,000.
On liquid pairs like major tokens on Uniswap or Raydium, 0.5 to 2 percent entry slippage is typical for moderate position sizes. On new or small-cap tokens, 3 to 15 percent is common. During high-traffic events like token launches or breaking news, even liquid pairs can see 5 to 10 percent slippage as everyone trades simultaneously.
Resources